Graphing radiation with a GMC-320 geiger counter using Cacti
by deaves
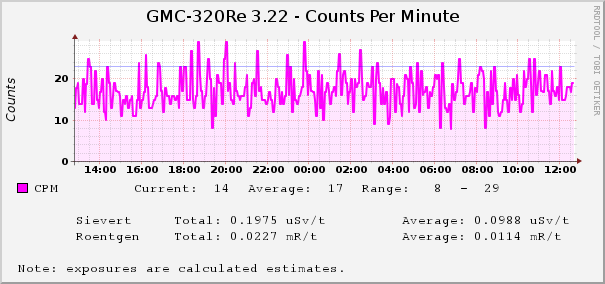
A few years ago, right after the Fukushima Daiichi nuclear disaster, XKCD released an awesome Radiation Dose Chart. Also around that time portable geiger counters became much easier to get a hold of and fairly cheap. Me being a data nerd; I researched a variety of devices and decided to get a CQ GMC-320. Its an awesome portable geiger counter that has a USB data-port on it that allows you to collect the CPM via a USB serial port. The following Cacti template and Python script is how I generated the following Graph.
Template: cacti_graph_template_gmc-320_-_cpm_values.zip
Additional GMC-320 Links
This Cacti template will import/update the following items:
CDEF
- Trend
- Geiger - sV [ALL]
- Geiger - sV [AVG]
- Geiger - mR [ALL]
- Geiger - mR [AVG]
GPRINT Preset
- Normal
- Exact Numbers
- MicroSievert
- Interger
- MilliRoentgen
Data Input Method
- GQ - GMC-320Re 3.22
Data Template
- GQ - CPM
Graph Template
- GMC-320 - CPM values